
P-Dash
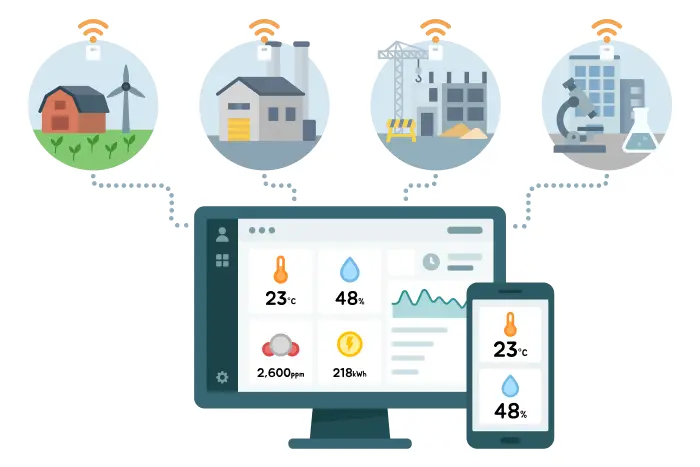
We custom-build web-based viewers so you can visually analyze and utilize your IoT data. We support custom interfaces, dashboards, and PC/Mobile modes.
We included only the essential features needed in the actual field
Easily monitor dozens or hundreds of sensors and data.
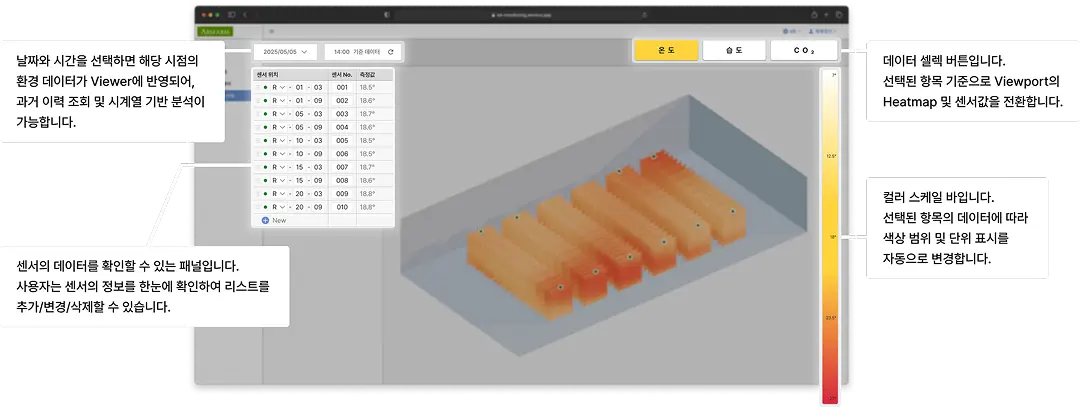
Sensor-based Visualization
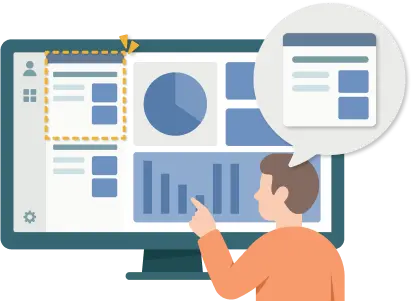
Display Item Customization
1:1 Custom Interface Configuration
We configure the system centering on sensor information desired by the customer, such as temperature and humidity, and you can freely set the user interface such as layout, field position, and menu structure.
Time-series Data Analysis
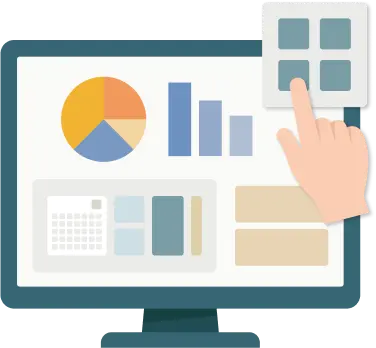
Intuitive Data Management
Customizable Dashboard
Users can visualize necessary information in their desired structure, and we maximize operational efficiency by providing dashboards optimized for each user type, such as facility teams and managers.
Lightweight and Fast Data Transfer
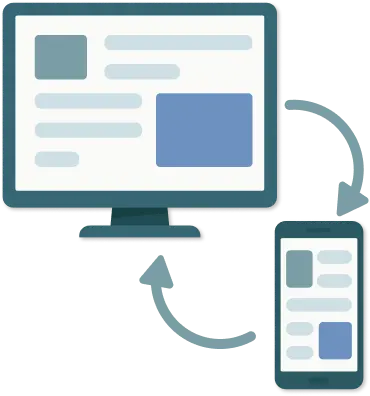
Operational Environment Without Time/Space Constraints
PC/Mobile Support
You can check information and respond in real-time via PC in the office and mobile on-site, providing a flexible environment operable on various devices.
Check Out More Custom Services
Features used directly in the field, Here is how they are utilized
Key feature application methods seen through actual customer cases
Smart Farm (L Company)
Operational efficiency through real-time monitoring and automatic notifications
- Sensors: Temperature / Humidity / CO₂
- Immediate warning display upon anomaly detection
- Administrator direct sensor location change and addition function
- Provision of customer-customized viewer module integrated with existing platform
“Anomaly signs in temperature came as immediate notifications, so the person in charge could take action right away. I definitely feel the operational efficiency.”